Root Cause Analysis
The article explains how AI-driven root cause analysis detects subtle, costly performance issues (“nano bugs”) in modern microservices architectures that traditional monitoring often misses. It contrasts a manual DevOps investigation with the automated, behavior aware approach of Dynatrace Davis AI, which quickly pinpoints the specific faulty query causing silent degradation and resource overuse.

Tomasz Olszowy
•
10
min.
Outside the Box: How AI Detects "Nano" Bugs in Microservices Architecture
Classic monitoring has accustomed us to a specific failure scenario. Highly recognizable indicators-such as Slack alerts in dedicated communication channels, an info-board filled with red alerts in the operations room, or high failure rate metrics-have traditionally been the harbingers of major ongoing trouble. However, in modern, highly distributed cloud systems, the scenarios requiring the detection of the most elusive problems look entirely different.
It turns out that these "silent" failures are simultaneously the most costly ones, while causing no complete system breakdown and triggering no traditional alert thresholds. Service quality and performance are degraded by an error loop running silently in the background, which gradually drains the budget. It is very much like the "slowly boiling frog" phenomenon.
Let us examine this problem and its characteristics from two perspectives: the traditional manual approach, and AI-driven Root Cause Analysis (RCA).
Incident Scenario: Silent Performance Degradation with System Data "Leakage"
Instead of a sudden, loud, and spectacular crash, we have a subtle architectural flaw in a distributed financial analytics platform.
During a routine code update, the team responsible for the reporting microservice changed how queries were executed against the PostgreSQL database. The new version of the service started executing N+1 queries, fetching complete object structures into memory and performing hundreds of additional I/O operations for each individual report, instead of retrieving compressed aggregates.
However, because the system had autoscaling enabled, the infrastructure was able to dynamically adapt to the growing load. The application continued to operate without throwing HTTP 500 errors, and customers only noticed a slight slowdown in service responsiveness. At first glance, the system appeared fully operational; unfortunately, the infrastructure was consuming several times more resources than necessary, and query costs were rising with every hour. The database was on the brink of overload (deadlock).
The Traditional Path: An Investigation in the Dark
In a classic DevOps model, this type of issue often goes unnoticed for days. When it finally lands on the engineers' desks, diagnosing it resembles a drawn-out investigation.
1. Lack of Pattern Detection
Since no single alert breached a critical threshold, the issue only surfaces during a cloud bill review or due to customer complaints about general slowdowns in report generation. Engineers face the daunting task of analyzing massive volumes of data without a clear starting point, as there is no single event in a specific timeframe where everything began to unravel.
2. Manual Log and Trace Analysis
Engineers focus on manually inspecting application logs and metrics in Grafana or Kibana, collecting trace samples across multiple microservices. In such a fast-changing environment with thousands of queries passing through every second, isolating a specific thread requires writing complex aggregation queries to compare them against older performance profiles.
3. False Leads and Cross-Layer Blame Games
The infrastructure team suspects database degradation and starts tuning it blindly. The backend team claims their code works fine because it raises no exceptions-though a lack of exceptions does not imply efficient code. A substantial amount of time is wasted on inter-team discussions. In many situations, this borders on a "blame game," while application traffic continuously generates unreasonably high costs.
4. Root Cause Discovery
After hours-often days-of tedious memory and execution profiling, a Senior Engineer identifies the root cause. They discover that a query in the reporting microservice is fetching an improper data scope, forcing the database to perform redundant disk operations.
The Modern Path: RCA Powered by Dynatrace Davis AI
Let us see how Dynatrace and its Davis AI engine handle the exact same scenario and problem-one that is extremely difficult for humans to spot-in the same environment.
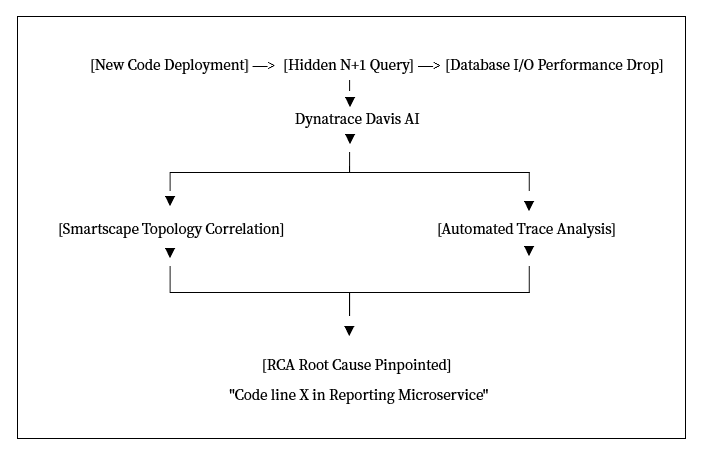
Dynatrace is not limited merely to checking whether a metric has breached a fixed threshold. Davis AI continuously learns the "behavioral profile" of the entire architecture, simultaneously analyzing metrics, logs, and traces while constructing a full real-time topology of dependencies.
1. Early Detection of Behavioral Anomaly
Despite the absence of visible or reported errors, Davis AI detects the breakdown of the communication pattern between the reporting microservice and the database. The AI notices a sharp spike in the ratio of SQL queries to a single business request.
2. Automated Root Cause Analysis (RCA)
To reach the root cause rather than just treating symptoms, the AI engine uses the Smartscape topology graph. Davis AI doesn't need human guidance on where to look. It autonomously initiates code-level tracing and compares execution paths against the history of environment changes.
3. Precise Answers Instead of Hypotheses
Instead of generating a generic "performance degradation" alert, Dynatrace Davis AI delivers precise information in a root-cause event card. The engineer receives a clear, structured notification directly pointing to the source of the issue:
"Performance anomaly detected: Reporting Microservice is generating a 150x spike in redundant SELECT SQL queries to the 'orders' table. Root cause identified in the newly deployed generateReport() method at line 142."
4. Immediate Remediation
Engineers don't waste time hunting down the issue. The diagnosis is served clearly on a silver platter. The team immediately prepares a hotfix or rolls back the reporting microservice to its previous version.
Measurable ROI: Time, Money, and Reputation
Leveraging AI for "silent" incident analysis dramatically alters a company's bottom line.
Metric | Traditional Path (Manual) | AI-Driven Path (Dynatrace Davis) |
|---|---|---|
Time to Detection (MTTD) | Hours / Days (Delayed detection) | A few minutes from the first query |
Time to Resolution (MTTR) | Many hours of tedious profiling | Automated (Provided in report) |
Infrastructure Cost | Drastic increase in cloud bills | Instant stoppage of unwanted costs |
Impact on Tech Debt | Team frustration & "blame games" | Precise, actionable feedback for developers |
1. Time Savings
When diagnosing hidden performance bugs, traditional methods result in hours or days spent digging through databases, logs, and source code. AI-driven tools shorten the investigation phase to mere minutes. Engineers can shift their time toward building valuable business features.
2. Financial Savings
The most expensive cloud errors are those you don't see right away. Autoscaling will happily absorb inefficient code by throwing more resources at it-problem solved, right? Until the bill arrives. Catching these bugs in minutes rather than days can save tens of thousands of dollars (or PLN) monthly.
3. Reputation & User Experience
A slow application rarely throws errors-it just frustrates users. Instead of getting an error screen, users experience a sluggish, clunky product and start looking for alternatives. Catching these issues at their root is the easiest path to a great User Experience. Companies that prioritize smooth performance win on quality.
Conclusion
Classic monitoring is no longer enough in a microservices world. The most dangerous errors are the silent ones that simple threshold triggers miss. AI-driven solutions like Dynatrace Davis turn the tables: instead of waiting for a system to crash or throw explicit errors, they detect micro-anomalies in real time and instantly pinpoint the exact line of code responsible.