Langfuse telemetry
Prototyping an LLM app is easy; taking it to production is hard. As soon as your application scales, questions arise that traditional logging tools can't answer:
Which specific prompt caused the spike in token costs?
Why did the model refuse the request in Europe but accept it in the US?
Why app sends the same prompt to LLM multiple times?
To build robust AI systems, you need deep observability. Langfuse is an open-source LLM engineering platform that provides the tracing capabilities necessary to navigate this new paradigm.
Through our case-study of SkillMatch, a CV-screening application developed and partially co-engineered using LLMs, you will learn how prompt versioning, iterative testing, and hybrid model deployment were handled in a production environment. The showcased application ranks candidates based on user-defined criteria, and integrates with SharePoint for data ingestion, illustrating how LLM workflows connect with enterprise environments. In this article, the lessons learned in building this system are presented:
how seemingly small prompt changes can have large operational impacts,
how hybrid (cloud/on-prem) deployments can reduce cost and improve control,
where classic ML operational practices break down when applied to LLMs.
Motivation
Why even bother? Why should I invest in any kind of observability in my AI app? Is there any difference between traditional and AI telemetry?
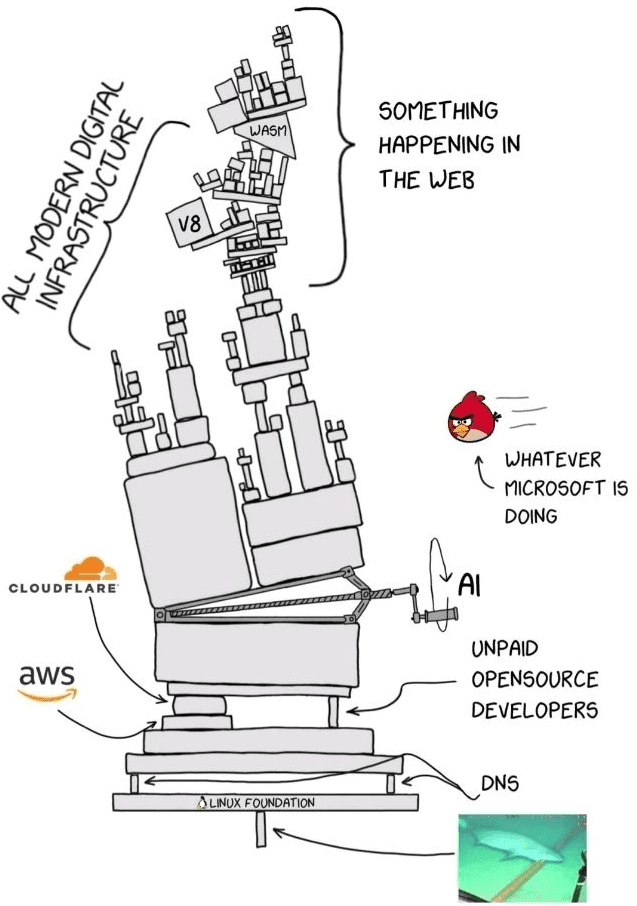
This diagram is a perfect, albeit terrifying, representation of the modern digital stack. It shows a complex, fragile engine - a Rube Goldberg machine - held together by multiple modern and considered as reliable platforms, including heroic effort of the OSS community.
Now, imagine trying to build a reliable application on top of this engine. In the past, software was somewhat deterministic; you knew how the gears turned. But today, we are building LLM applications on top of this already chaotic infrastructure. We are adding a layer of "AI" - a component that is inherently probabilistic, fuzzy, and unpredictable - right in the middle of the storm.
When your LLM app breaks, it doesn't just throw a standard error code. It might hallucinate, it might get stuck in a loop, or it just might silently skyrocket your API bill. In this environment, "hope" is not a strategy. You cannot simply trust that the "angry birds" of bad data or the "sharks" of latency spikes won't bite.
Without deep observability tools, you are flying blind through a storm of "SOMETHING HAPPENING IN THE WEB." You need to be able to trace a query from your user, combining them into sessions, through the vector store, past the model providers, and back again. You need to see exactly where the machine jammed, which prompt caused the delay, and how many tokens were burned.
Skillmatch app
Most of the app is hosted in kubernetes cluster, especially the skillmatch app and langfuse. Among them, LiteLLM as LLM gateway is deployed, but that setup, also with self-hosted qwen model, will be describe in other article.
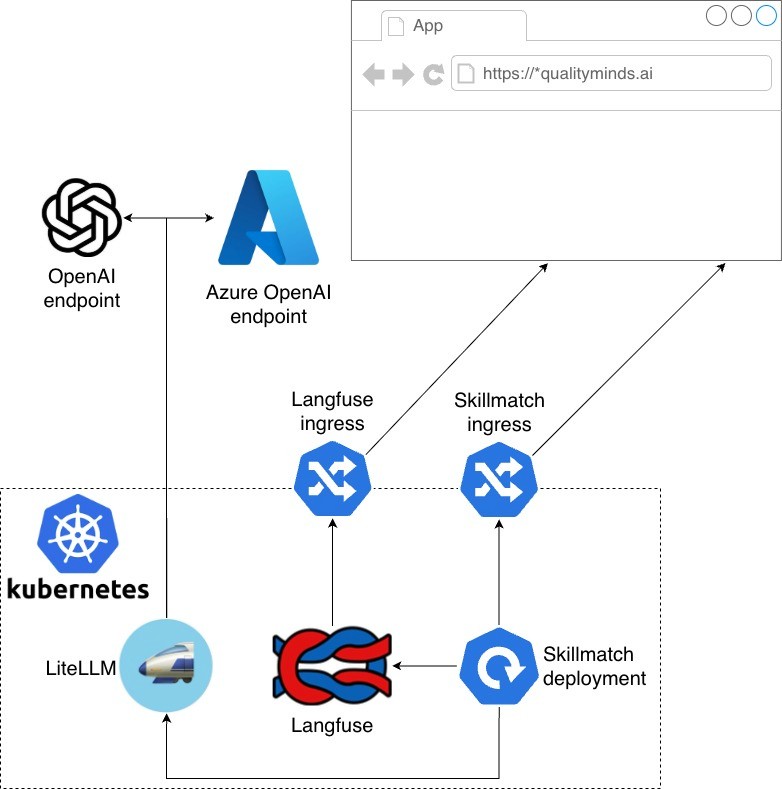
App uses two gpt-4o models from OpenAI and Azure: one as primary, second as backup in case of any distruptions. For production, we also have fallback to model hosted inside cluster via vLLM.
Main purpose for this deployments is to find perfect match inside QualityMinds for specific tasks, roles, and projects. It grabs information from following sources:
QM-styled CVs stored in SharePoint,
Jira boards and tickets related to a QM person,
Some information scrapped from ERP, related to tasks in our projects.
Based on the prompt sent to the app and the information provided, a matching process is performed, using semantic similarity matching using pre-generated embeddings. LLM-based matching was also implemented for comparison. A more detailed description of it may be the topic of one of our AI team's future articles.
Employ telemetry into your app
So, how do we bring telemetry into your app? Integrating Langfuse is designed to be as frictionless as possible, ensuring that adding observability doesn't add complexity to your codebase.
The Langfuse SDK is built to fit seamlessly into your existing workflow, abstracting away the heavy lifting of instrumentation. You generally won't find yourself rewriting your application logic to accommodate tracing. Instead, Langfuse offers a set of decorated LLM API providers and convenient Python decorators.
If you are using a popular framework like OpenAI or Anthropic, you can simply swap out your standard client initialization with the Langfuse-wrapped version. With that single change, every prompt, completion, and token usage is automatically captured and sent to your dashboard. For custom functions or complex chains, the SDK allows you to add @observe decorators to your methods. This transforms a standard Python function into a fully traced span, capturing inputs, outputs, and execution time without cluttering your business logic with manual logging code.
Let's go through our implementation.
Batch processing scripts
First, batch operations are performed to load data from the ERP and Jira. This is accomplished using standard scripts executed as cron jobs. To properly implement LLM call tracing, simply use the @observe decorator on the main function. That's all.
--- a/process_jira_board.py
+++ b/process_jira_board.py
@@ -1,4 +1,5 @@
 import argparse
+from langfuse import observe

 from skillmatch.jira_util import login
 from skillmatch.request_matching import process_issue


-if __name__ == "__main__":
+@observe(name="process_jira_board")
+def main():
     load_dotenv()
     parser = argparse.ArgumentParser(description="Process all Jira issues in a project/board")
     parser.add_argument("--project_id", help="Jira project ID", type=str, default="TPI")
@@ -58,3 +60,7 @@ if __name__ == "__main__":
                 continue

         print(f"\nCompleted processing {len(issues)} issues.")
+
+
+if __name__ == "__main__":
+    main()
--- a/process_jira_board.py
+++ b/process_jira_board.py
@@ -1,4 +1,5 @@
import argparse
+from langfuse import observe
from skillmatch.jira_util import login
from skillmatch.request_matching import process_issue
-if __name__ == "__main__":
+@observe(name="process_jira_board")
+def main():
load_dotenv()
parser = argparse.ArgumentParser(description="Process all Jira issues in a project/board")
parser.add_argument("--project_id", help="Jira project ID", type=str, default="TPI")
@@ -58,3 +60,7 @@ if __name__ == "__main__":
continue
print(f"\nCompleted processing {len(issues)} issues.")
+
+
+if __name__ == "__main__":
+ main()--- a/process_jira_board.py
+++ b/process_jira_board.py
@@ -1,4 +1,5 @@
import argparse
+from langfuse import observe
from skillmatch.jira_util import login
from skillmatch.request_matching import process_issue
-if __name__ == "__main__":
+@observe(name="process_jira_board")
+def main():
load_dotenv()
parser = argparse.ArgumentParser(description="Process all Jira issues in a project/board")
parser.add_argument("--project_id", help="Jira project ID", type=str, default="TPI")
@@ -58,3 +60,7 @@ if __name__ == "__main__":
continue
print(f"\nCompleted processing {len(issues)} issues.")
+
+
+if __name__ == "__main__":
+ main()--- a/process_jira_ticket.py
+++ b/process_jira_ticket.py
@@ -1,5 +1,6 @@
import argparse
from pathlib import Path
+from langfuse import observe
from skillmatch.jira_util import login
from skillmatch.request_matching import process_issue
@@ -11,7 +12,9 @@ from dotenv import load_dotenv
from skillmatch.utils.config import ConfigManager
from skillmatch.utils.moco_util import get_hotlist
-if __name__ == "__main__":
+
+@observe(name="process_jira_ticket")
+def main():
load_dotenv()
parser = argparse.ArgumentParser(description="Process Jira ticket")
parser.add_argument("--ticket_key", help="Jira ticket", type=str)
@@ -40,3 +43,7 @@ if __name__ == "__main__":
relevant_cv_names = None
process_issue(issue, jira, relevant_cv_names=relevant_cv_names, dry_run =args.dry_run)
+
+
+if __name__ == "__main__":
+ main()API part
The second case involves using clients directly, in our case AzureOpenAI. In this case, replacing the client import from the one wrapped by langfuse is sufficient.
--- a/skillmatch/utils/llm_client.py
+++ b/skillmatch/utils/llm_client.py
@@ -3,7 +3,8 @@ Shared Azure OpenAI client for the CV matching system.
 """
 import logging
 from typing import List, Dict
-from openai import AzureOpenAI
+from langfuse.openai import AzureOpenAI
+from langfuse import observe
 from .config import ConfigManager
 from .hash_str import hash_str

 class LLMClient:
     self.client = AzureOpenAI(api_key=api_key, api_version=api_version, azure_endpoint=endpoint)
     self.logger = logging.getLogger("llm_client")

+    @observe()
     def chat_completion(
         self, messages: List[Dict[str, str]], model: str = None, reasoning_effort: str = None
     ) -> str:
--- a/skillmatch/utils/llm_client.py
+++ b/skillmatch/utils/llm_client.py
@@ -3,7 +3,8 @@ Shared Azure OpenAI client for the CV matching system.
"""
import logging
from typing import List, Dict
-from openai import AzureOpenAI
+from langfuse.openai import AzureOpenAI
+from langfuse import observe
from .config import ConfigManager
from .hash_str import hash_str
class LLMClient:
self.client = AzureOpenAI(api_key=api_key, api_version=api_version, azure_endpoint=endpoint)
self.logger = logging.getLogger("llm_client")
+ @observe()
def chat_completion(
self, messages: List[Dict[str, str]], model: str = None, reasoning_effort: str = None
) -> str:--- a/skillmatch/utils/llm_client.py
+++ b/skillmatch/utils/llm_client.py
@@ -3,7 +3,8 @@ Shared Azure OpenAI client for the CV matching system.
"""
import logging
from typing import List, Dict
-from openai import AzureOpenAI
+from langfuse.openai import AzureOpenAI
+from langfuse import observe
from .config import ConfigManager
from .hash_str import hash_str
class LLMClient:
self.client = AzureOpenAI(api_key=api_key, api_version=api_version, azure_endpoint=endpoint)
self.logger = logging.getLogger("llm_client")
+ @observe()
def chat_completion(
self, messages: List[Dict[str, str]], model: str = None, reasoning_effort: str = None
) -> str:Additionally, we used the @observe decorator for all methods, including private ones, to accurately evaluate the call sequence later.
--- a/skillmatch/matching/embedding_generator.py
+++ b/skillmatch/matching/embedding_generator.py
@@ -9,7 +9,8 @@ import numpy as np
 import tiktoken
 from pathlib import Path
 from typing import List, Dict, Any
+from langfuse import observe

 from ..data.models import CVData, JobData
 from ..storage.base import BaseStorage
@@ -58,6 +59,7 @@ class EmbeddingGenerator:
             return self._truncate_text(text, max_tokens=8192)
         return text

+    @observe()
     def _generate_embeddings_batch(self, texts: List[str]) -> List[List[float]]:
         """Generate embeddings for multiple texts in a batch."""
         # Prepare texts
@@ -67,6 +69,7 @@ class EmbeddingGenerator:

         return [item.embedding for item in response.data]

+    @observe()
     def _generate_embedding(self, text: str) -> List[float]:
         """Generate embedding for single text."""
         prepared_text = self._prepare_text_for_embedding(text)
@@ -82,6 +85,7 @@ class EmbeddingGenerator:
         structured_data = {k: v for k, v in data.items() if k not in ["raw_text", "embeddings", "date_extracted"]}
         return json.dumps(structured_data, ensure_ascii=False, indent=2)

+    @observe()
     def generate_cv_embeddings(self, cv: CVData) -> Dict[str, np.array]:
         """
         Generate embeddings for both raw and structured CV data.
@@ -108,6 +112,7 @@ class EmbeddingGenerator:

         return embeddings

+    @observe()
     def generate_job_embeddings(self, job: JobData) -> Dict[str, np.array]:
         """
         Generate embeddings for both raw and structured job data
Use the telemetry you just set
The above changes are the only ones implemented in the context of implementing LLM telemetry. However, for it to work properly, three environment variables must be set.
os.environ["LANGFUSE_PUBLIC_KEY"] = "pk-lf-<rest-of-the-key>"
os.environ["LANGFUSE_SECRET_KEY"] = "sk-lf-<rest-of-the-key>"
os.environ["LANGFUSE_BASE_URL"] = "http://langfuse-web.langfuse.svc.cluster.local:3000"
os.environ["LANGFUSE_PUBLIC_KEY"] = "pk-lf-<rest-of-the-key>"
os.environ["LANGFUSE_SECRET_KEY"] = "sk-lf-<rest-of-the-key>"
os.environ["LANGFUSE_BASE_URL"] = "http://langfuse-web.langfuse.svc.cluster.local:3000"
os.environ["LANGFUSE_PUBLIC_KEY"] = "pk-lf-<rest-of-the-key>"
os.environ["LANGFUSE_SECRET_KEY"] = "sk-lf-<rest-of-the-key>"
os.environ["LANGFUSE_BASE_URL"] = "http://langfuse-web.langfuse.svc.cluster.local:3000"
os.environ["LANGFUSE_PUBLIC_KEY"] = "pk-lf-<rest-of-the-key>"
os.environ["LANGFUSE_SECRET_KEY"] = "sk-lf-<rest-of-the-key>"
os.environ["LANGFUSE_BASE_URL"] = "http://langfuse-web.langfuse.svc.cluster.local:3000"
As the application is running inside the same kubernetes cluster as Langfuse, we set the base url using its service URL. Keys can be generated in Langfuse project.
If everything is set up, you can use your app and see tracings inside Langfuse.
The example contains a trace for one prompt, i.e. searching for the best candidate for the submitted offer.
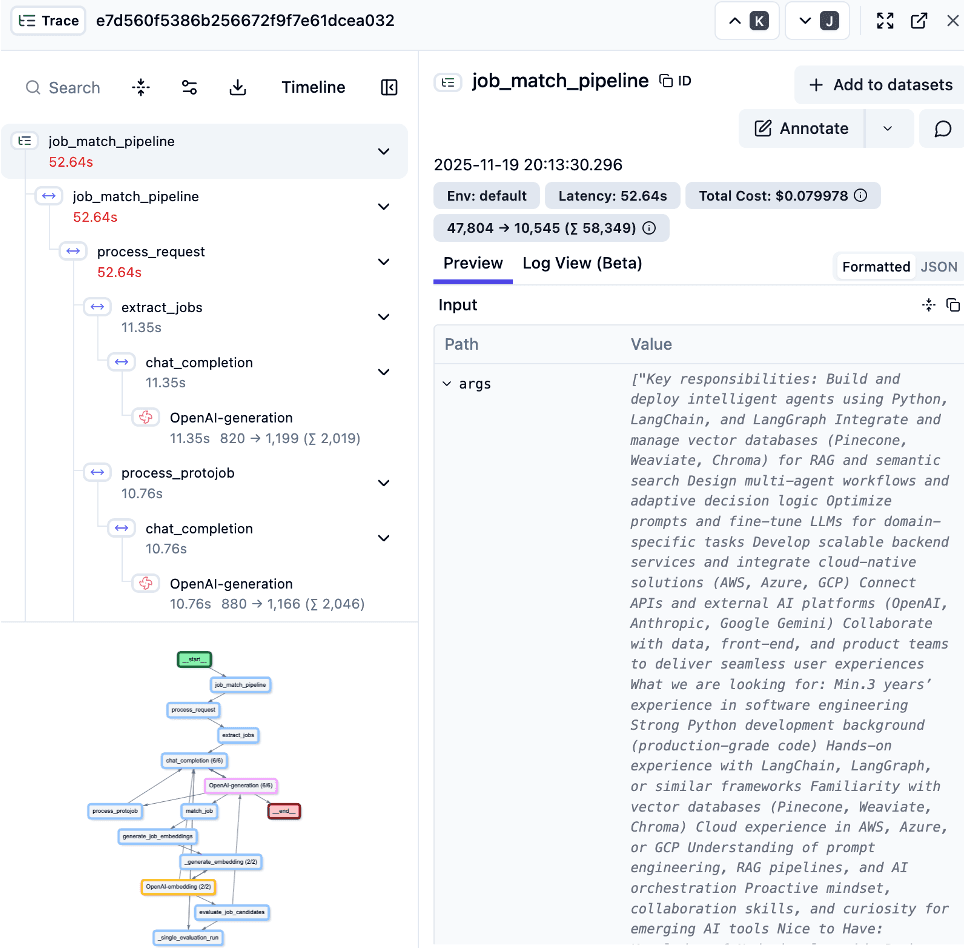
This approach allows not only to track specific calls, behaviors, or errors at various stages of execution, but also the number of input and output tokens and the estimated cost of such a trace based on them.
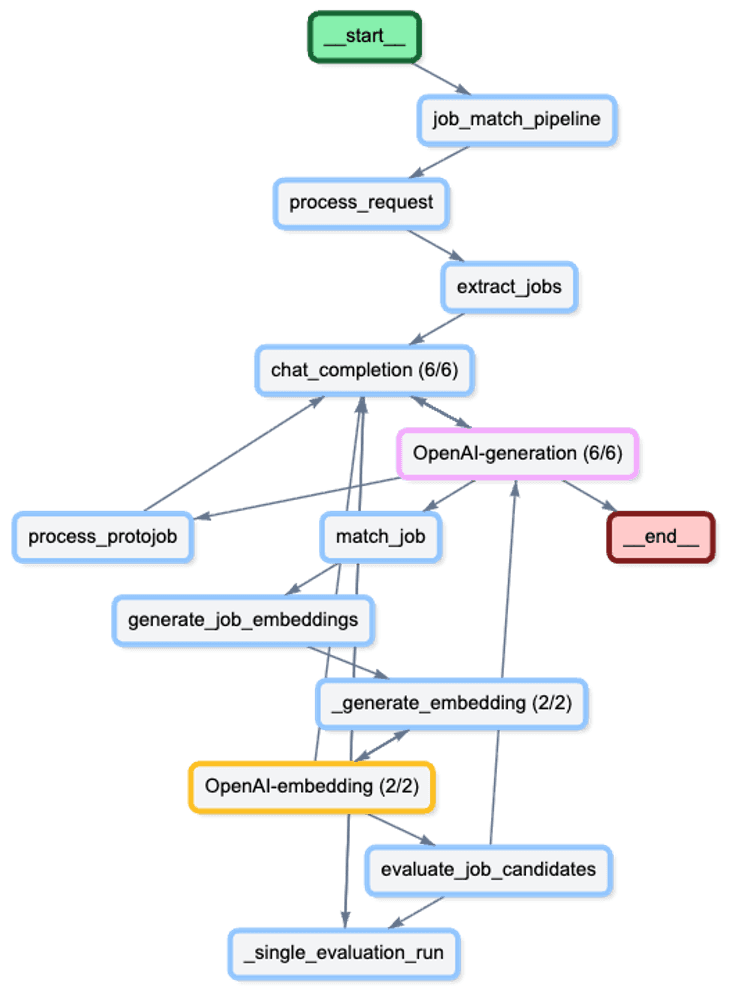
A more accurate view of the pipeline looks like this:
What did we accomplish by using telemetry?
After integrating Langfuse into our application, the value of telemetry became immediate. We weren't just collecting data for the sake of it; we uncovered a critical inefficiency that had remained invisible to us during development. Let's take a closer look on that pipeline.
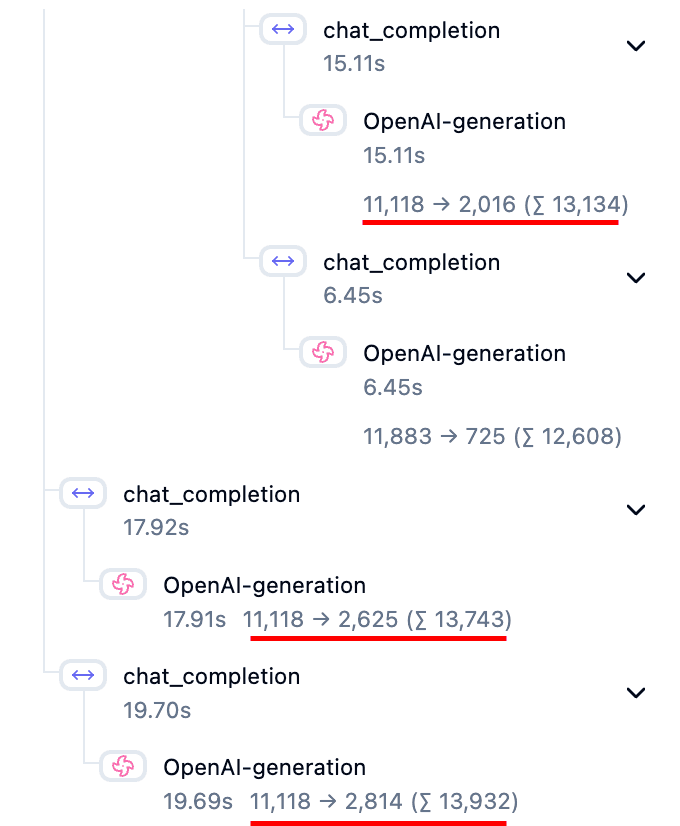
Upon reviewing our first traces, an anomaly stood out: our core prompt was being executed three times for a single user request. This redundancy was subtle in the code logic but obvious in the telemetry timeline. Identifying this bug allowed us to optimize our backend logic, instantly cutting our latency by almost third and significantly reducing our token costs. This discovery proved that without deep visibility, we were effectively throwing resources into the "digital machine" without realizing it. Telemetry gave us the insight needed to plug the leak and run a leaner, faster operation.
Conclusion
Implementing Langfuse has transformed our approach to developing LLM applications. What began as a simple integration - using just decorators on our "single prompt" architecture - quickly paid dividends by exposing hidden redundancies and optimizing our performance.
While our current implementation focuses on tracing these individual requests without yet tracking full user sessions, the insights we've gained lay a strong foundation for future work. We plan to introduce session management to better understand the full context of user interactions.
Furthermore, we are excited to integrate Token-Oriented Object Notation (TOON) into our stack. By moving away from complex JSON definitions in our system prompts to structured tool outputs, we anticipate even greater efficiency and a further reduction in token costs. In a complex ecosystem, observability tools like Langfuse don't just help fix bugs - they guide towards more cost-effective architectural decisions.


