Is Prometheus still a viable option for modern observability needs?
Modern observability require from monitoring solutions to deliver several important features.

Tomasz Żyłka
•
2
min.
Modern observability require from monitoring solutions to deliver several important features:
performance
efficiency
low total cost of ownership (TCO)
cheap long-term storage
high availability
flexibility of configuration and deployments model
extensible query language
Performance has always been a priority for the Prometheus team and allows a fast writing and reading path of metrics. High performance is needed to store a high volume of metrics and allow users configuration like dashboards to present complex data without noticeable delay and execute alerting rules on time.
Current trend is that modern observability deployments not only support cloud providers but also Kubernetes clusters. Kubernetes offer out of the box much more flexibility than cloud providers because scaling up or down is done much quicker to dynamically change to accomodate workloads needs. Unfortunately this option puts a lot of pressure on monitoring solutions because it generates a lot of new time series that are constantly created named churn in Prometheus. The main issue is that high churn puts a lot of pressure off observability software itself by high memory and CPU usage needed to accommodate more and more new time series and lower efficiency of queries that require consuming extra memory and CPU resources to generate results.
Efficiency is defined as usage of minimal needed resources like CPU and memory to store metrics data and perform user queries. Prometheus achieves that by usage of efficient algorithms to compress and store metrics data. To achieve an efficient data model in Prometheus there was need to rewrite and improve the engine over years and even abandon backwards compatibility data format when Prometheus changed its major version.
Prometheus’ low TCO was achieved by implementing an efficient algorithm to compress and store data organised into chunks and blocks. Role of proper data format is not only related to lower space occupied by metrics but also provides efficient searches for queries. Query language and its parser was also optimised for low memory and CPU footprint.
Prometheus’ only storage option is to use local attached volumes that are available via filesystem. Recommended option to store metrics data is to use no-mechanical hard drives like SSDs or NVMEs flash drives. Prometheus in the past was also optimised to be used with mechanical hard drives but over time non-mechanical drives became the preferred solution. Even when SSDs or NVMEs are used there is a hard limit for performance of what a single box could offer and Prometheus could saturate hardware resources and vertical scaling has its own limitation mostly driven by costs.
Prometheus doesn’t offer long term storage support and is not recommended for long time retention deployments. Prometheus was not designed for that even though it is proven that local storage could work for long retention. Prometheus supports a limited way of handling corrupted data that could happen anytime when metrics data are stored for a long time. Corrupted data could break queries or even make all metrics data unreadable and the only solution is to delete all existing data. Also long time retention often leads to high space usage which is really expensive for SSDs and NVMEs. Prometheus doesn't support any kind of tiering for metrics data and all data need to be stored on the same volume. Filesystem of the local drive also becomes a bottleneck when storing a lot of data on a large volume. Prometheus developers encouraged community members to build proper solutions for long time retention periods and overtime Prometheus compatible solutions were built that stored metrics in object storage.
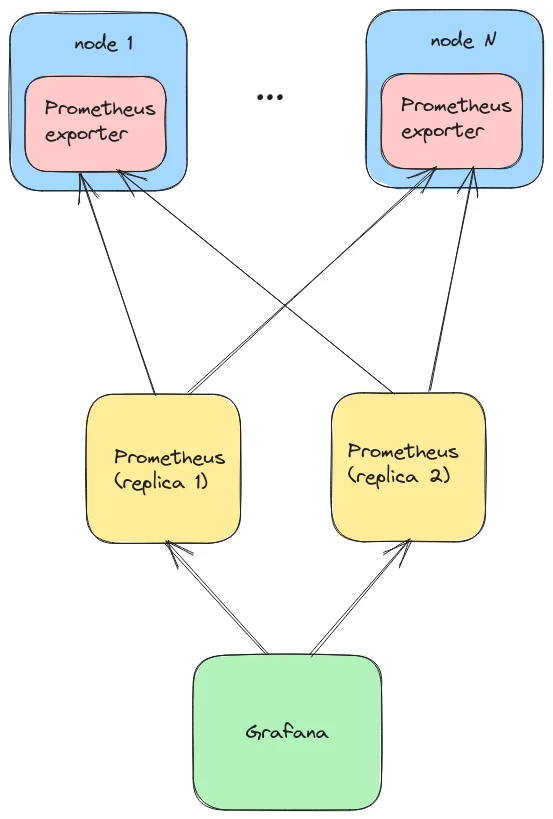
High availability in Prometheus is also limited because it uses a simple redundancy model. High availability is achieved by adding another Prometheus instance to work as a pair for redundancy purpose but it leads to double the requests of scraped data and double the space needed to store them. Prometheus instances work totally independently of each other in total separation which don’t allow query engines to actively use both of engines for queries and fill the gap if they happened in time series.
Redundancy doesn't offer any resilience for high cardinality issues in metrics which could happen without any warning and bring Prometheus' instance down. Because high availability acts as a mirror any high cardinality problems automatically happened in both of Prometheus. Also each single instance of Prometheus consists of a single Linux process and shares a single path for read and writes of metrics data and could break each other. It’s quite easy to generate a query of doom in Prometheus and break it by exhausting all memory resources allocated to Prometheus.
Flexibility of configuration and deployments model in modern observability is needed to support a variety of different environments that consist of bare metal or virtual machines or different cloud providers or Kubernetes clusters. Prometheus delivers a variety of choices by supporting dynamic inventory named service discovery. Prometheus automates the process of dynamically gathering targets from a given vendor and avoids the need for static configuration that need to be updated over time.
Because the user's environment became complex and complicated, the query language also needed to support all varieties of scenarios. Query language is not only limited to query metrics but also transform them and enrich queries with functions and operators.
Prometheus supports several key features required by monitoring in the modern observability landscape like performance and efficiency and flexibility. There are limits what Prometheus could offer and if target deployment requires separation of write and read path or require long-term storage or high ability there is need to look for other Prometheus compatible solutions like Thanos or Cortex or Mimir.

